Source: [The Picower Institute News | September 17, 2020]
To understand the massive capabilities and complexities of the brain, neuroscientists segment it into regions based on what they appear to do—like processing what we sense or how to move. What’s been lacking, however, is an ability to tie those functional maps precisely and consistently to matching distinctions of physical structure, especially in live animals while they are performing the functions of interest. In a new study, MIT researchers demonstrate a new way to do that, providing an unprecedented pairing of functional mapping in live mice with distinguishing structural information for each region all the way through the cortex into deeper tissue below.
“Our study shows for the first time that structural and functional coupling of visual areas in the mouse brain can be detected at sub-cellular resolution in vivo,” wrote the authors based in the lab of Mriganka Sur, Newton Professor of Neuroscience in The Picower Institute for Learning and Memory and the Department of Brain and Cognitive Sciences at MIT.
The technique could give scientists more precise ways to distinguish the borders and contents of regions they wish to study and could help them better understand the way that structural distinctions develop within individuals in different functional regions over time. Sur’s lab, for instance, is intensely interested in understanding the especially complex development of vision. Humans have 35 or so distinct functional regions that contribute to processing vision, Sur notes, and even mice have 10.
“There is something profound in the way that vision is represented and created in mammalian brains,” Sur said. “Where do these areas come from, what do they mean and what do they do? It has not been easy to understand how they differ. The critical thing is to precisely map or match the functional representation of each area with its anatomical uniqueness.”
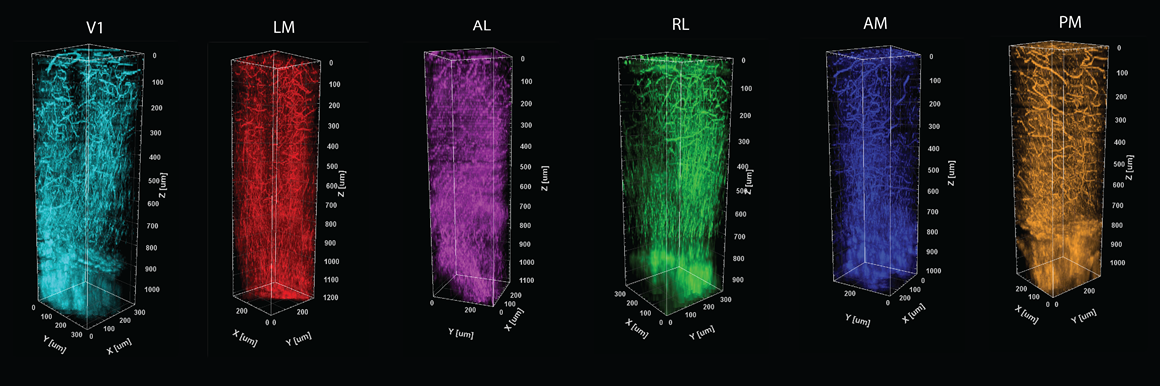
Above: A distinct thicket of vessels and myelin fibers are evident in each of six color coded visual processing regions in the cortex of a mouse. The columns are formed by stacking images taken at 5-micron increments through a millimeter of depth in each of the regions.
Combining function and structure
To develop tools to help answer those questions, postdoc Murat Yildirim led the study published in Biomedical Optics Express. In it he describes how the research team combined a method of charting functional areas—retinotopic mapping—with deep structural information measured by a technology he has helped to pioneer—third-harmonic generation (THG) three-photon microscopy.
In retinotopic mapping, researchers can identify functional regions by engineering neurons to flash when they become electrically active (and show changes in calcium) in response to a particular stimulation. For example, scientists could show a mouse a pattern moving across a screen and mark where neurons light up, with each area showing a characteristic location and pattern of response.